
Record
Capture counts, measurements, habits, etc. by date.

Your activity, pixel by pixel
Habits, effort, and precious memories. Record them with a simple API, and Pixela will grow them into a vivid graph.
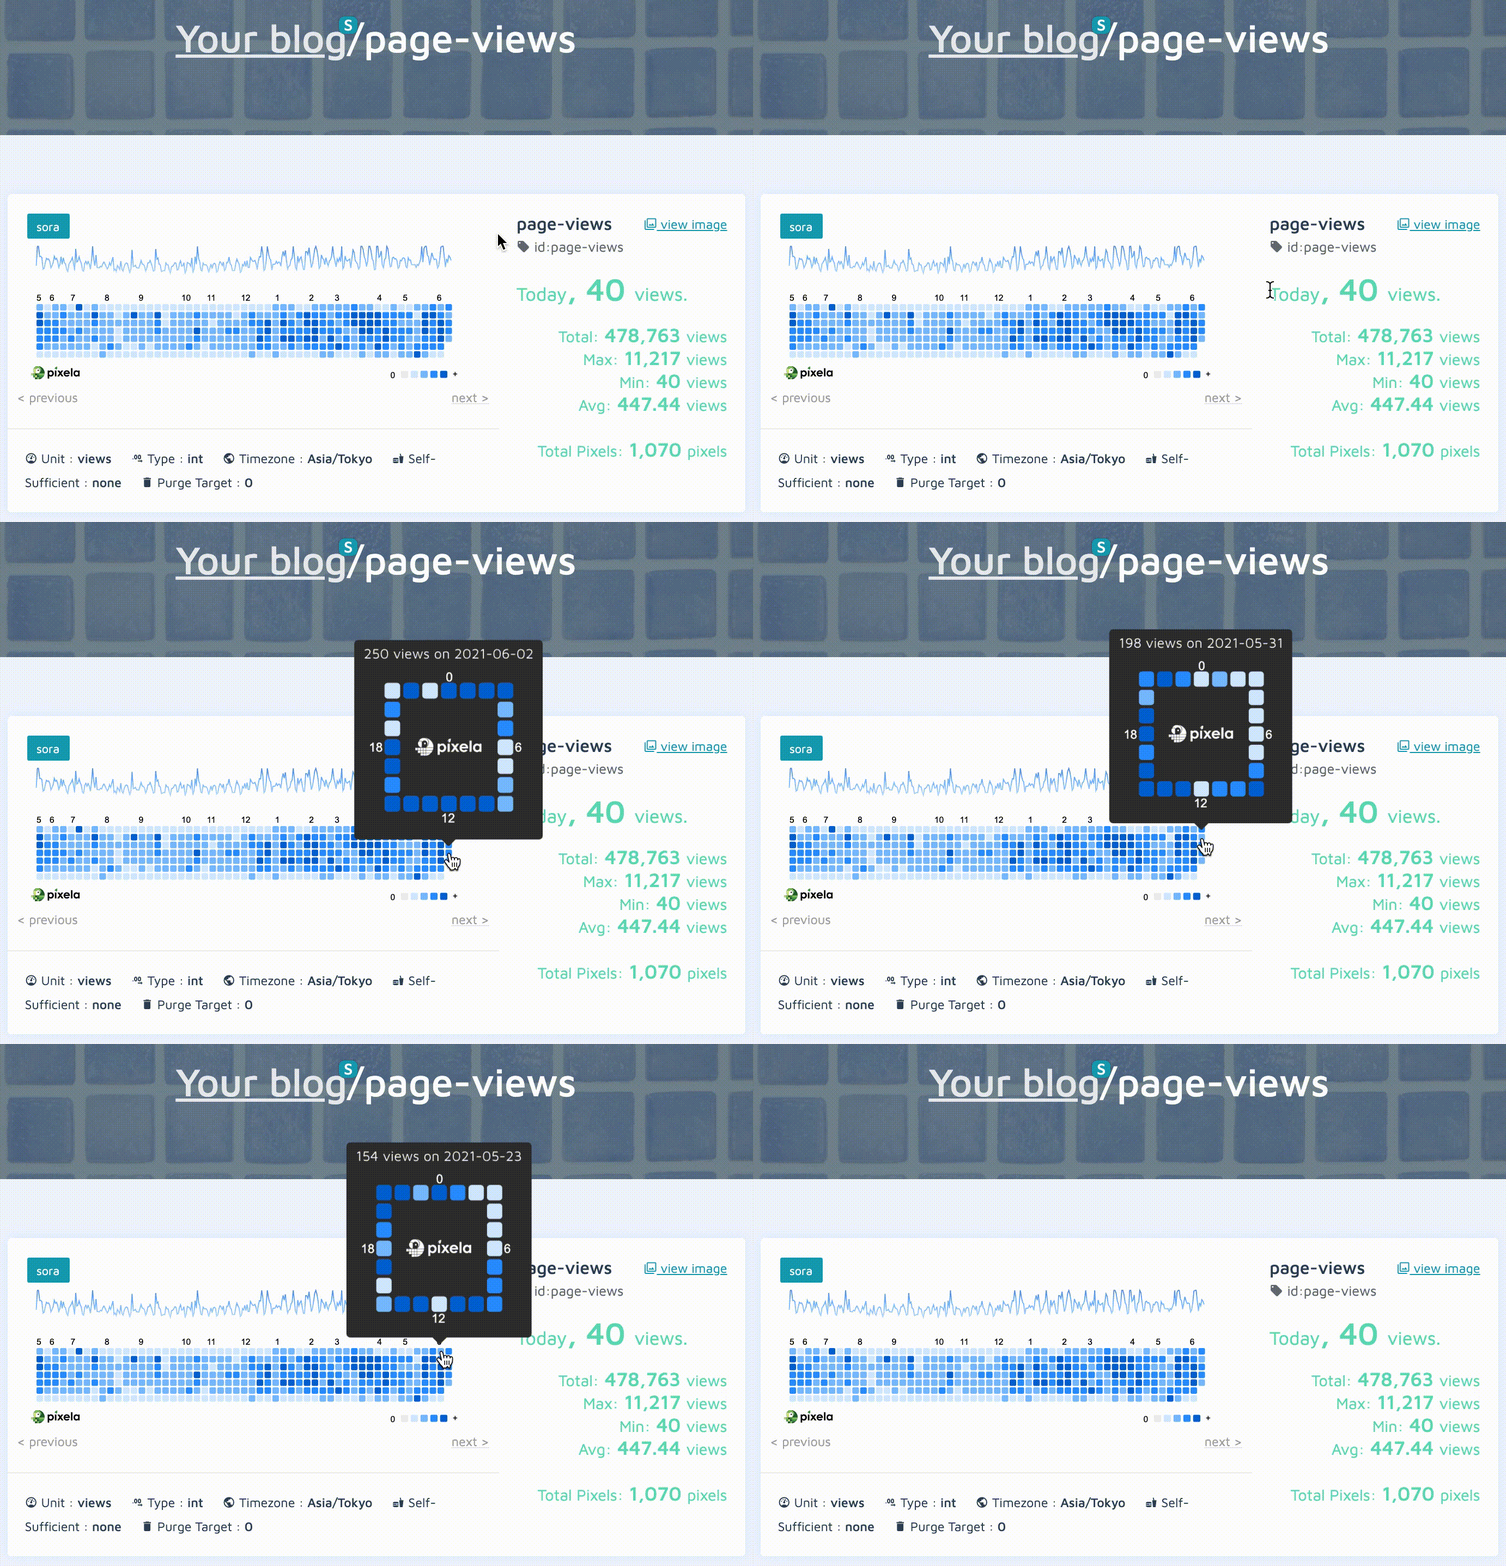
About Pixela
Send one value for one date. Pixela stores it, color-codes each day, and gives you a graph you can share or build into your own workflow.
Capture counts, measurements, habits, etc. by date.
See momentum as a color-scaled graph, badge, or detailed view.
Simply add an API call to your existing system and use Pixela as a fully managed store for daily-series data.
Use cases
From software development to personal habits and health tracking.
Use the same API to record anything you want to keep going.

Connect Pixela to CI/CD and make shipping visible as a graph or compact badge.
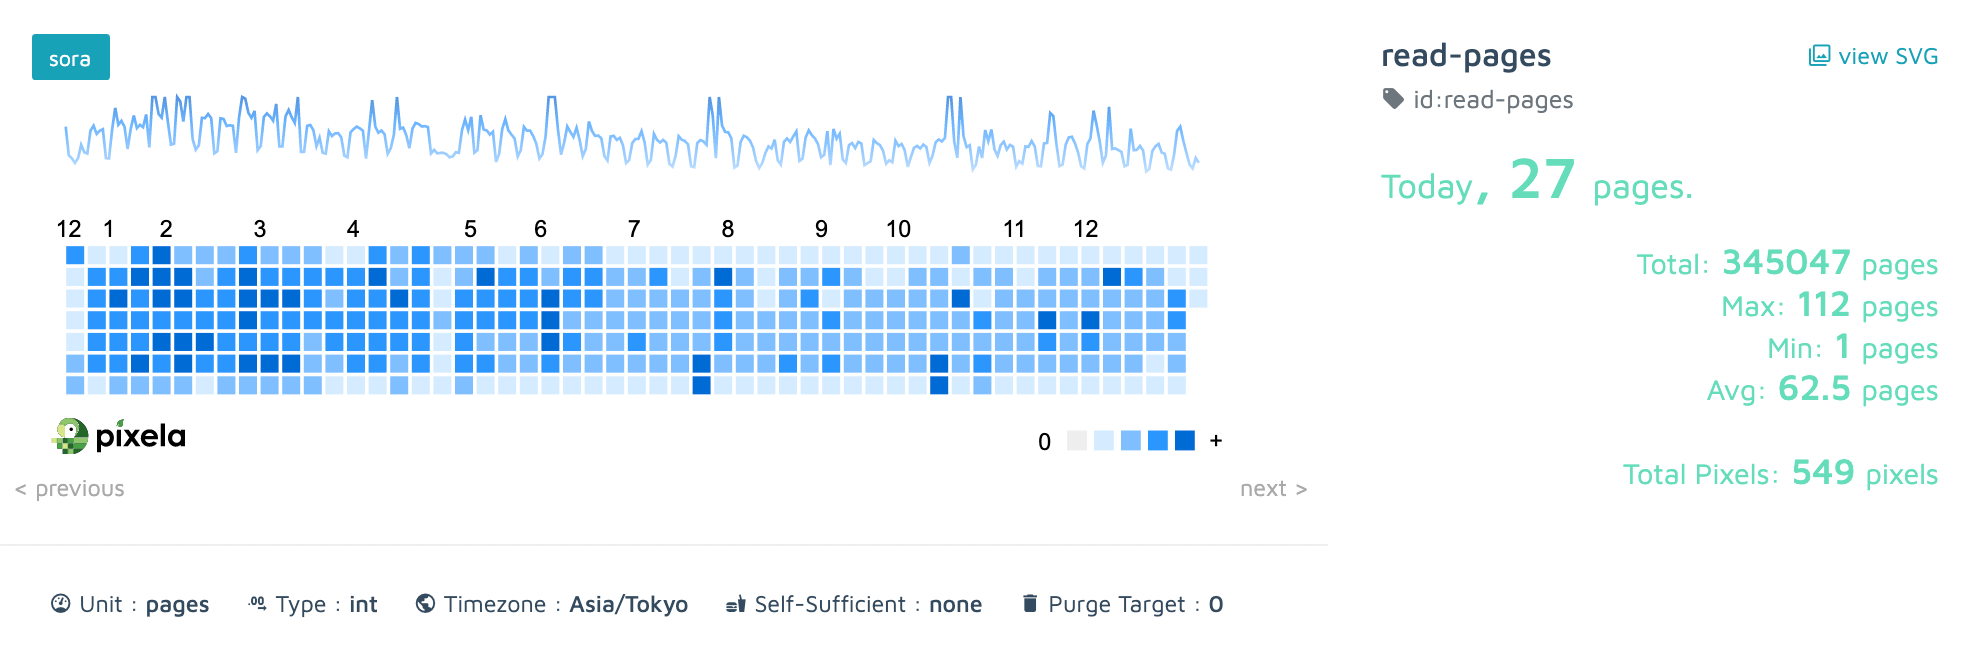
Record pages from Shortcuts, a smart speaker, the iOS app, or your own automation.

Track gains and losses. Pixela accepts negative values and supports incoming webhooks.
Pixela supporters
Most Pixela features are free, but you can support Pixela through Patreon and unlock supporter-only features. You can also become a logo or icon sponsor and have your logo or icon featured here.
Want to support Pixela? Become a Patreon supporter or learn about logo and icon sponsorship.
Quick start
Pixela's service interface is centered on a REST-style API.
Dive into the world of Pixela from the console on your machine!
Call /v1/users API by HTTP POST.
$ curl -X POST https://pixe.la/v1/users -d '{"token":"thisissecret", "username":"a-know", "agreeTermsOfService":"yes", "notMinor":"yes"}'
{"message":"Success.","isSuccess":true}Call /v1/users/<username>/graphs by HTTP POST.
$ curl -X POST https://pixe.la/v1/users/a-know/graphs -H 'X-USER-TOKEN:thisissecret' -d '{"id":"test-graph","name":"graph-name","unit":"commit","type":"int","color":"shibafu"}'
{"message":"Success.","isSuccess":true}Browse https://pixe.la/v1/users/a-know/graphs/test-graph! This is also the /v1/users/<username>/graphs/<graphID> API.
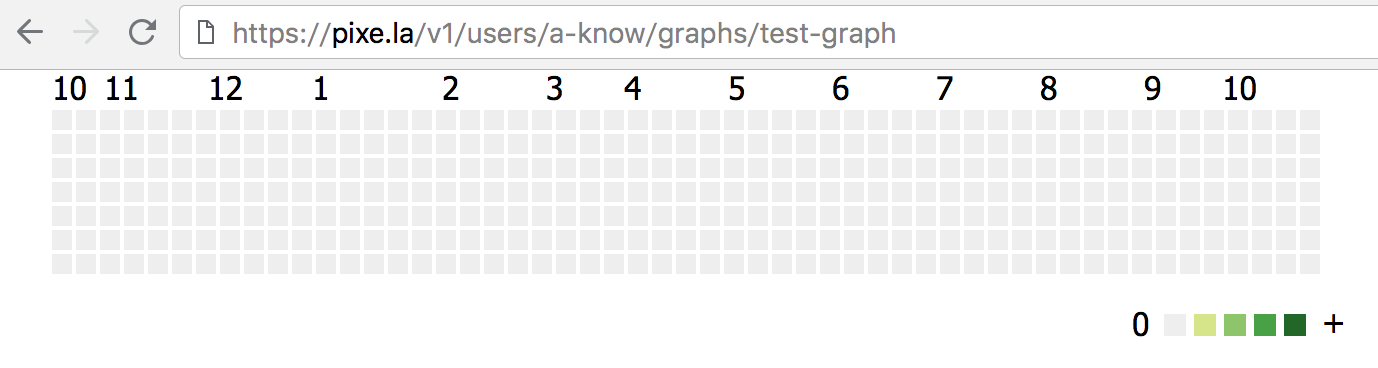
Call /v1/users/<username>/graphs/<graphID> by HTTP POST.
$ curl -X POST https://pixe.la/v1/users/a-know/graphs/test-graph -H 'X-USER-TOKEN:thisissecret' -d '{"date":"20180915","quantity":"5"}'
{"message":"Success.","isSuccess":true}Browse https://pixe.la/v1/users/a-know/graphs/test-graph, again!
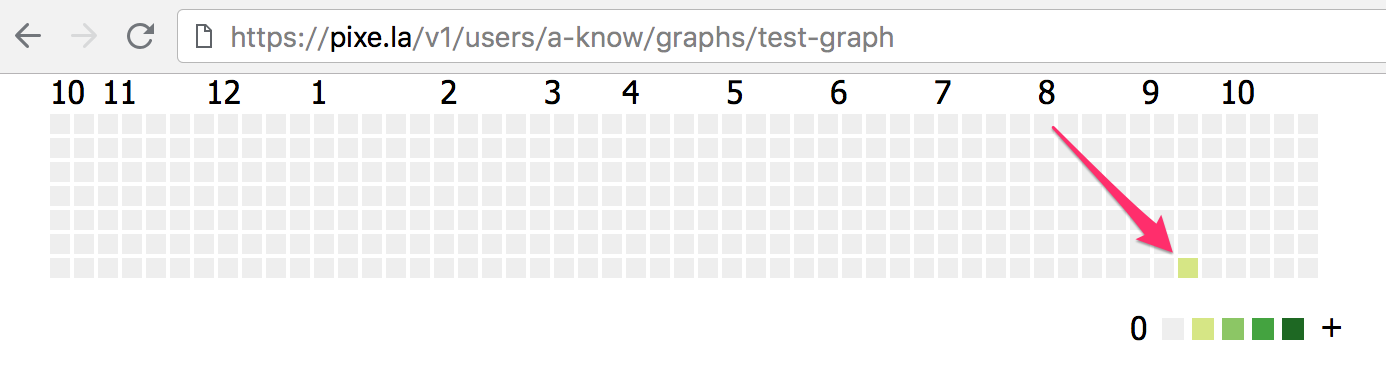
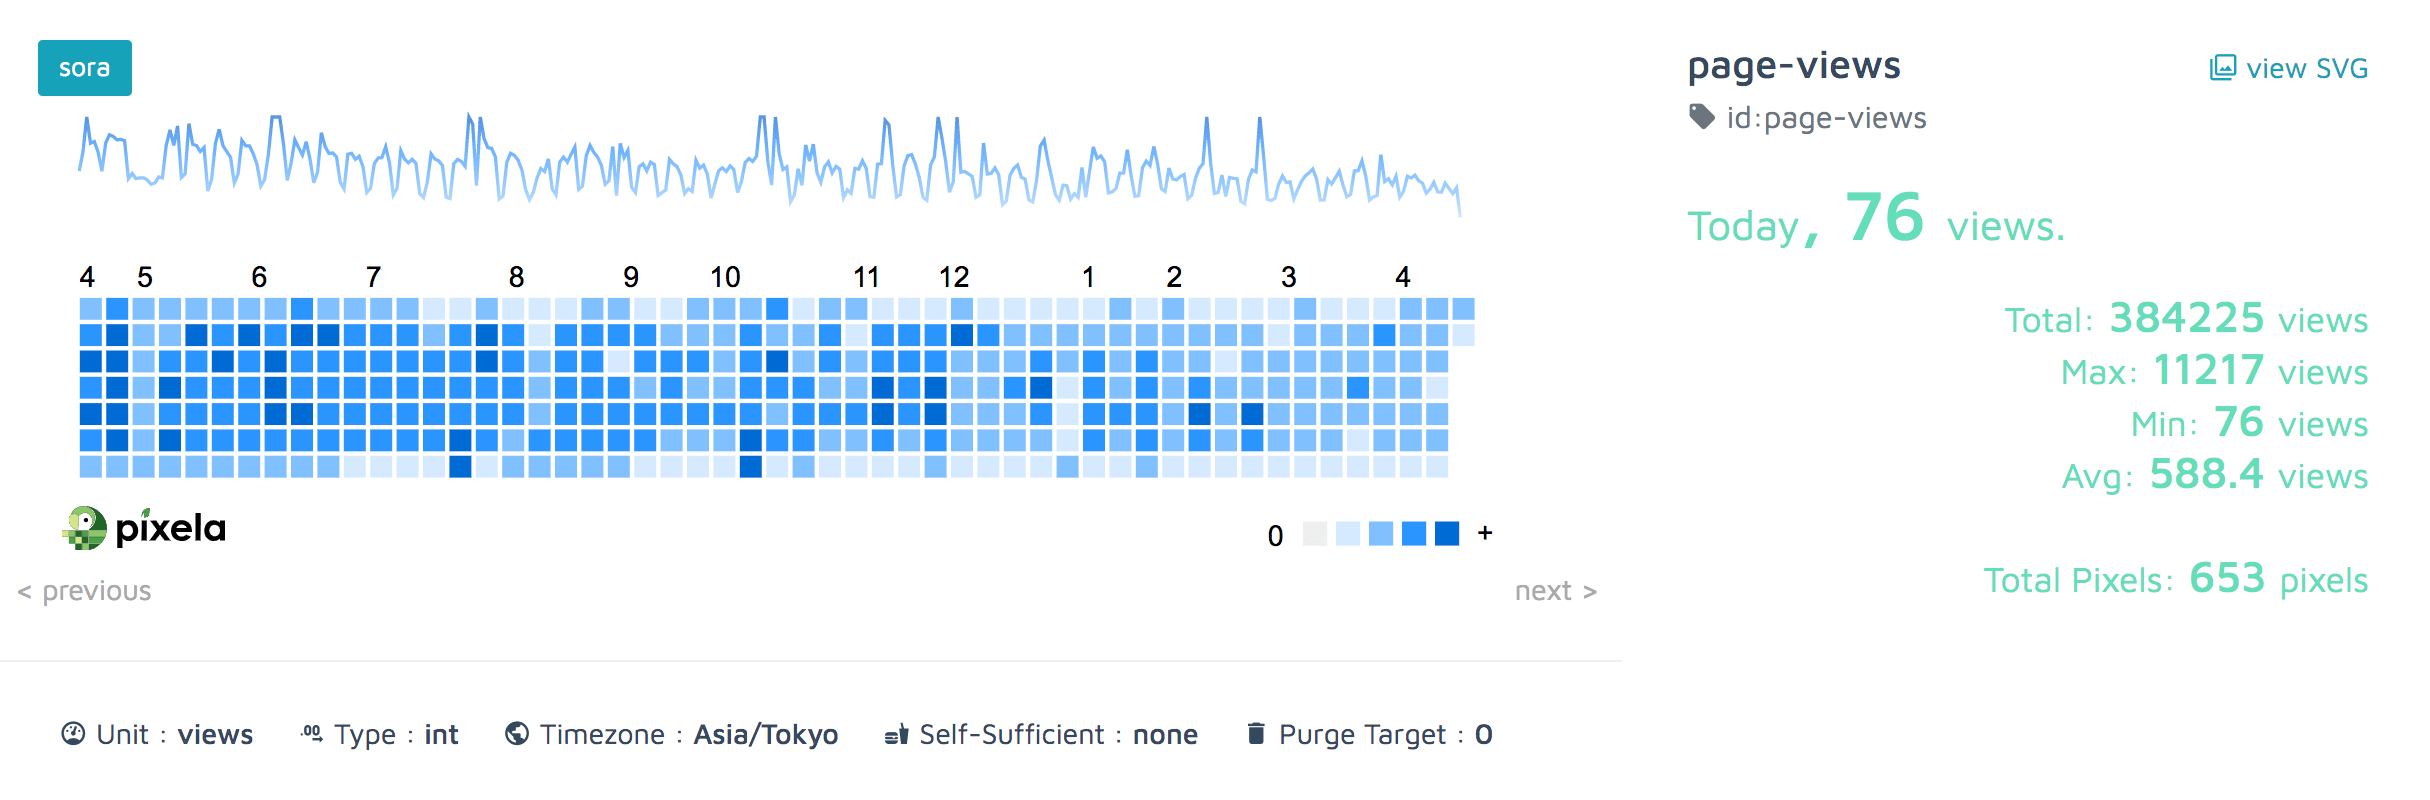
Add .html to the end of the URL and open it in your browser for more information. (https://pixe.la/v1/users/a-know/graphs/test-graph.html)
Community stories
From CI pipelines to smart speakers, these community articles show what a tiny API can unlock.
Visualize activity from a GitHub Actions workflow.
DevelopmentConnect continuous integration with a daily graph.
AutomationSend data to Pixela from a lightweight Google script.
CloudUpdate a graph with a serverless function.
Smart homeRecord activity through a voice-driven routine.
HardwareMake a physical button add a pixel.
ToolingUse Pixela without leaving your terminal.
Ready when you are
One API call is enough to begin a graph you can keep growing.